In an era dominated by technology, electronic waste, or e-waste, has emerged as a pressing environmental challenge. A newly released e-waste infographic by the Environmental Protection Agency (EPA) and leading tech organizations paints a stark picture of the issue in the United States. With millions of tons of discarded electronics piling up annually, this visual data tool highlights critical statistics, regional disparities, and the urgent need for sustainable solutions. This article delves into the key findings of the infographic, explores its implications for stakeholders, and examines what lies ahead in tackling this growing crisis.
Key Insights from the E-Waste Infographic
The recently published e-waste infographic offers a comprehensive look at the scale of electronic waste in the U.S. According to the data, Americans generated approximately 6.9 million tons of e-waste in 2022 alone. Only about 25% of this waste was recycled, leaving a significant portion to end up in landfills or be improperly disposed of, posing risks to both the environment and public health.
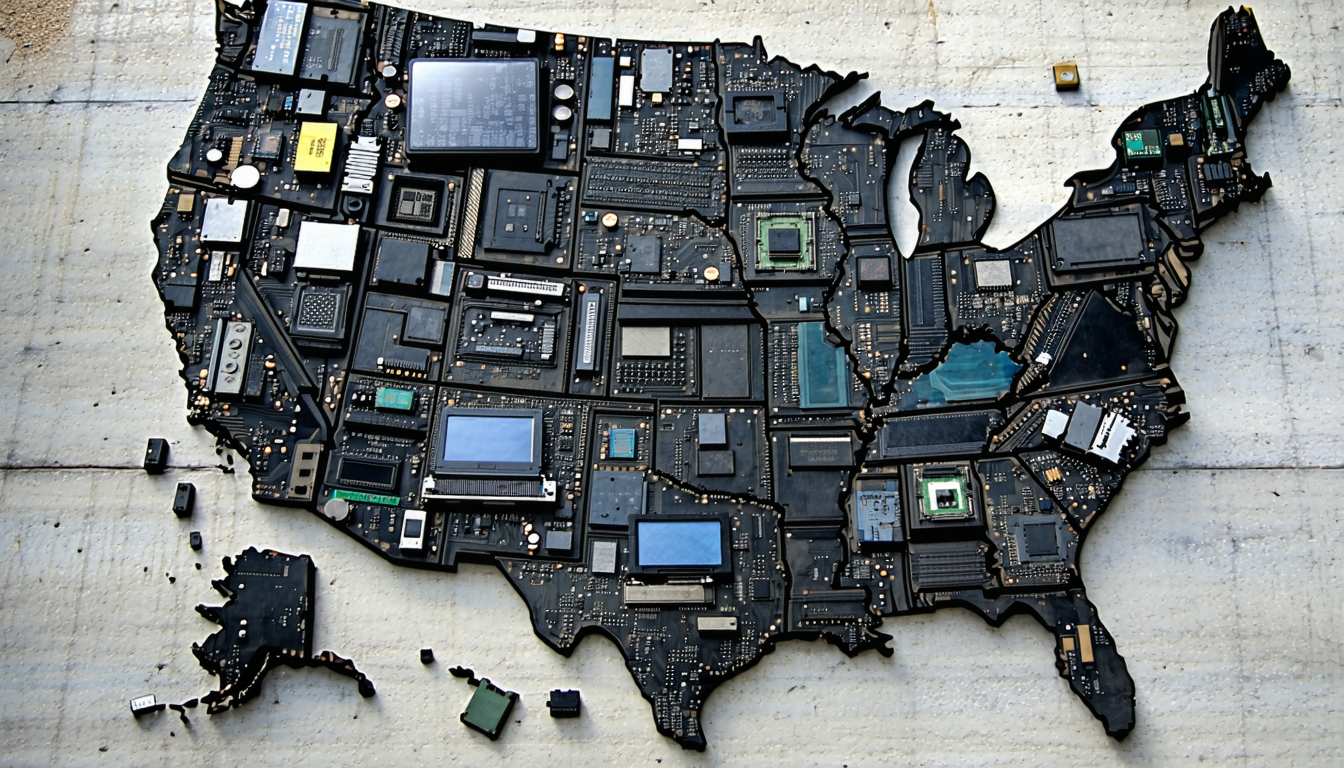
The infographic also breaks down e-waste by category, revealing that smartphones, laptops, and televisions account for a large share of discarded items. States like California, Texas, and New York lead in e-waste generation due to their high population density and tech-heavy economies. These visuals make it clear that without intervention, the problem will only worsen as technology consumption continues to rise.
Environmental and Health Impacts of E-Waste
Beyond sheer volume, the e-waste infographic underscores the severe consequences of improper disposal. Electronics often contain hazardous materials such as lead, mercury, and cadmium, which can leach into soil and water if not handled correctly. This contamination threatens ecosystems and human health, particularly in communities near landfills.
According to Dr. Emily Harper, an environmental scientist at GreenTech Solutions, “The toxins from e-waste can cause long-term damage, including respiratory issues and neurological disorders. We need stricter regulations and better public awareness to address this silent crisis.” The infographic serves as a wake-up call for policymakers and citizens alike to prioritize safe disposal and recycling practices.
Economic Stakes and Industry Responsibility
The financial implications of e-waste are equally significant. The infographic highlights that unrecycled electronics represent a loss of valuable materials like gold, silver, and rare earth metals—resources worth billions annually. Recovering these materials through proper recycling could boost the economy while reducing the need for environmentally damaging mining operations.
Tech companies are increasingly under scrutiny for their role in this issue. Many stakeholders argue that manufacturers should adopt extended producer responsibility (EPR) programs, ensuring they manage the lifecycle of their products. As John Carter, a policy analyst at TechWaste Watch, notes, “Corporations must invest in take-back programs and design products with recyclability in mind.”
Regional Disparities and Policy Gaps
One striking aspect of the e-waste infographic is the uneven distribution of recycling infrastructure across the U.S. While states like California have robust programs with accessible drop-off points, rural areas in the Midwest and South often lack such facilities. This disparity means that many Americans have no practical way to recycle their old devices.
Federal policies on e-waste remain fragmented, with only 25 states having specific laws governing electronic waste disposal as of 2023. The infographic emphasizes the need for a unified national strategy to streamline recycling efforts and enforce compliance. Without cohesive action, the burden falls disproportionately on local governments and underserved communities.
Future Outlook: Solutions on the Horizon
Looking ahead, the e-waste infographic points to potential pathways for progress. Innovations in recycling technology, such as automated sorting systems and chemical recovery processes, could improve efficiency. Public education campaigns are also vital to encourage responsible consumer behavior.
On a broader scale, collaboration between government, industry, and environmental groups will be key. Some experts advocate for incentives like tax breaks for companies that prioritize sustainable practices. While challenges remain, the data presented in the infographic offers a roadmap for reducing e-waste’s impact if acted upon swiftly.
Conclusion
The release of this e-waste infographic marks a pivotal moment in understanding the scale of electronic waste in the United States. From alarming statistics—6.9 million tons generated yearly—to stark regional disparities and health risks, the visual tool lays bare a crisis that demands immediate attention. As technology continues to evolve, so must our strategies for managing its aftermath. By fostering innovation, strengthening policies, and promoting accountability among stakeholders, there is hope for a future where e-waste no longer threatens our environment or economy.
Frequently Asked Questions (FAQ)
1. What is an e-waste infographic?
An e-waste infographic is a visual representation of data related to electronic waste, including generation rates, recycling statistics, and environmental impacts. It simplifies complex information for better public understanding.
2. How much e-waste does the U.S. produce annually?
According to recent data highlighted in the infographic, the U.S. generates about 6.9 million tons of e-waste each year.
3. Why is e-waste a problem?
E-waste contains hazardous materials that can harm the environment and human health if not properly managed. Additionally, unrecycled electronics result in lost valuable resources.
4. How can individuals help reduce e-waste?
Individuals can recycle old devices at designated centers, participate in take-back programs offered by manufacturers, and opt for repair over replacement when possible.
5. Are there national laws for e-waste management in the U.S.?
Currently, there is no comprehensive federal law; only 25 states have specific e-waste regulations. A unified national policy is still under discussion.